


Stacked hero
Figure, single-image
Section heading
/ / / Dredging
Live concentration data supported higher solids production
Mean solids rose from 24.63% to 33.54% after operators could see the live reading; solids held 60% more stable. Results vary by dredge, material and how the crew uses the data.
Prose
Section heading
What the meter watched
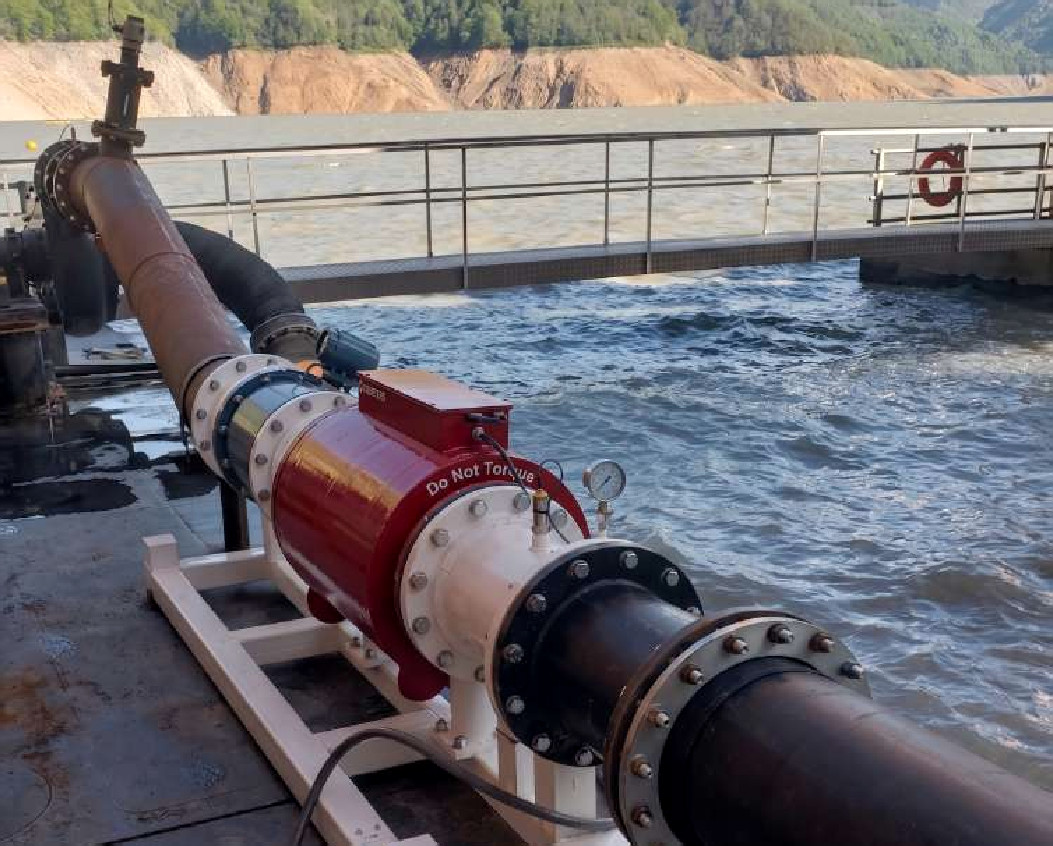
The Red Meter sat on the discharge line. Over several days, through startup and steady running, the study logged percent solids, discharge pressure, flow and temperature.
Results table
Section heading
Unguided startup against the guided run
| Metric | Unguided | Guided | Change |
|---|---|---|---|
| Mean solids | 24.63% | 33.54% | +36% production |
| Solids stability, std. dev. | ±3.48% | ±2.16% | 60% more stable |
| Time in the target band | < 5% | > 85% | Most of the run in band |
| Estimated sand | 240 m3/h | 330 m3/h | Timeline reduced about 30% |
Prose
Section heading
Stable readings from 28 °C down to 16 °C
Ambient temperature fell from 28 °C to 16 °C and the readings stayed stable. Once operators used the meter, morning and afternoon shifts reached the same high-efficiency band.
Call to action
Section heading
Bring us your discharge line
Tell us your pipe size and what runs through it. We will confirm whether the Red Meter fits and show you the software. You do not need to assemble a group for the first conversation.
Button, primary
Book a Demo