


Split section
Column
Prose
Section heading
/ / / The Red Meter
The full bore.
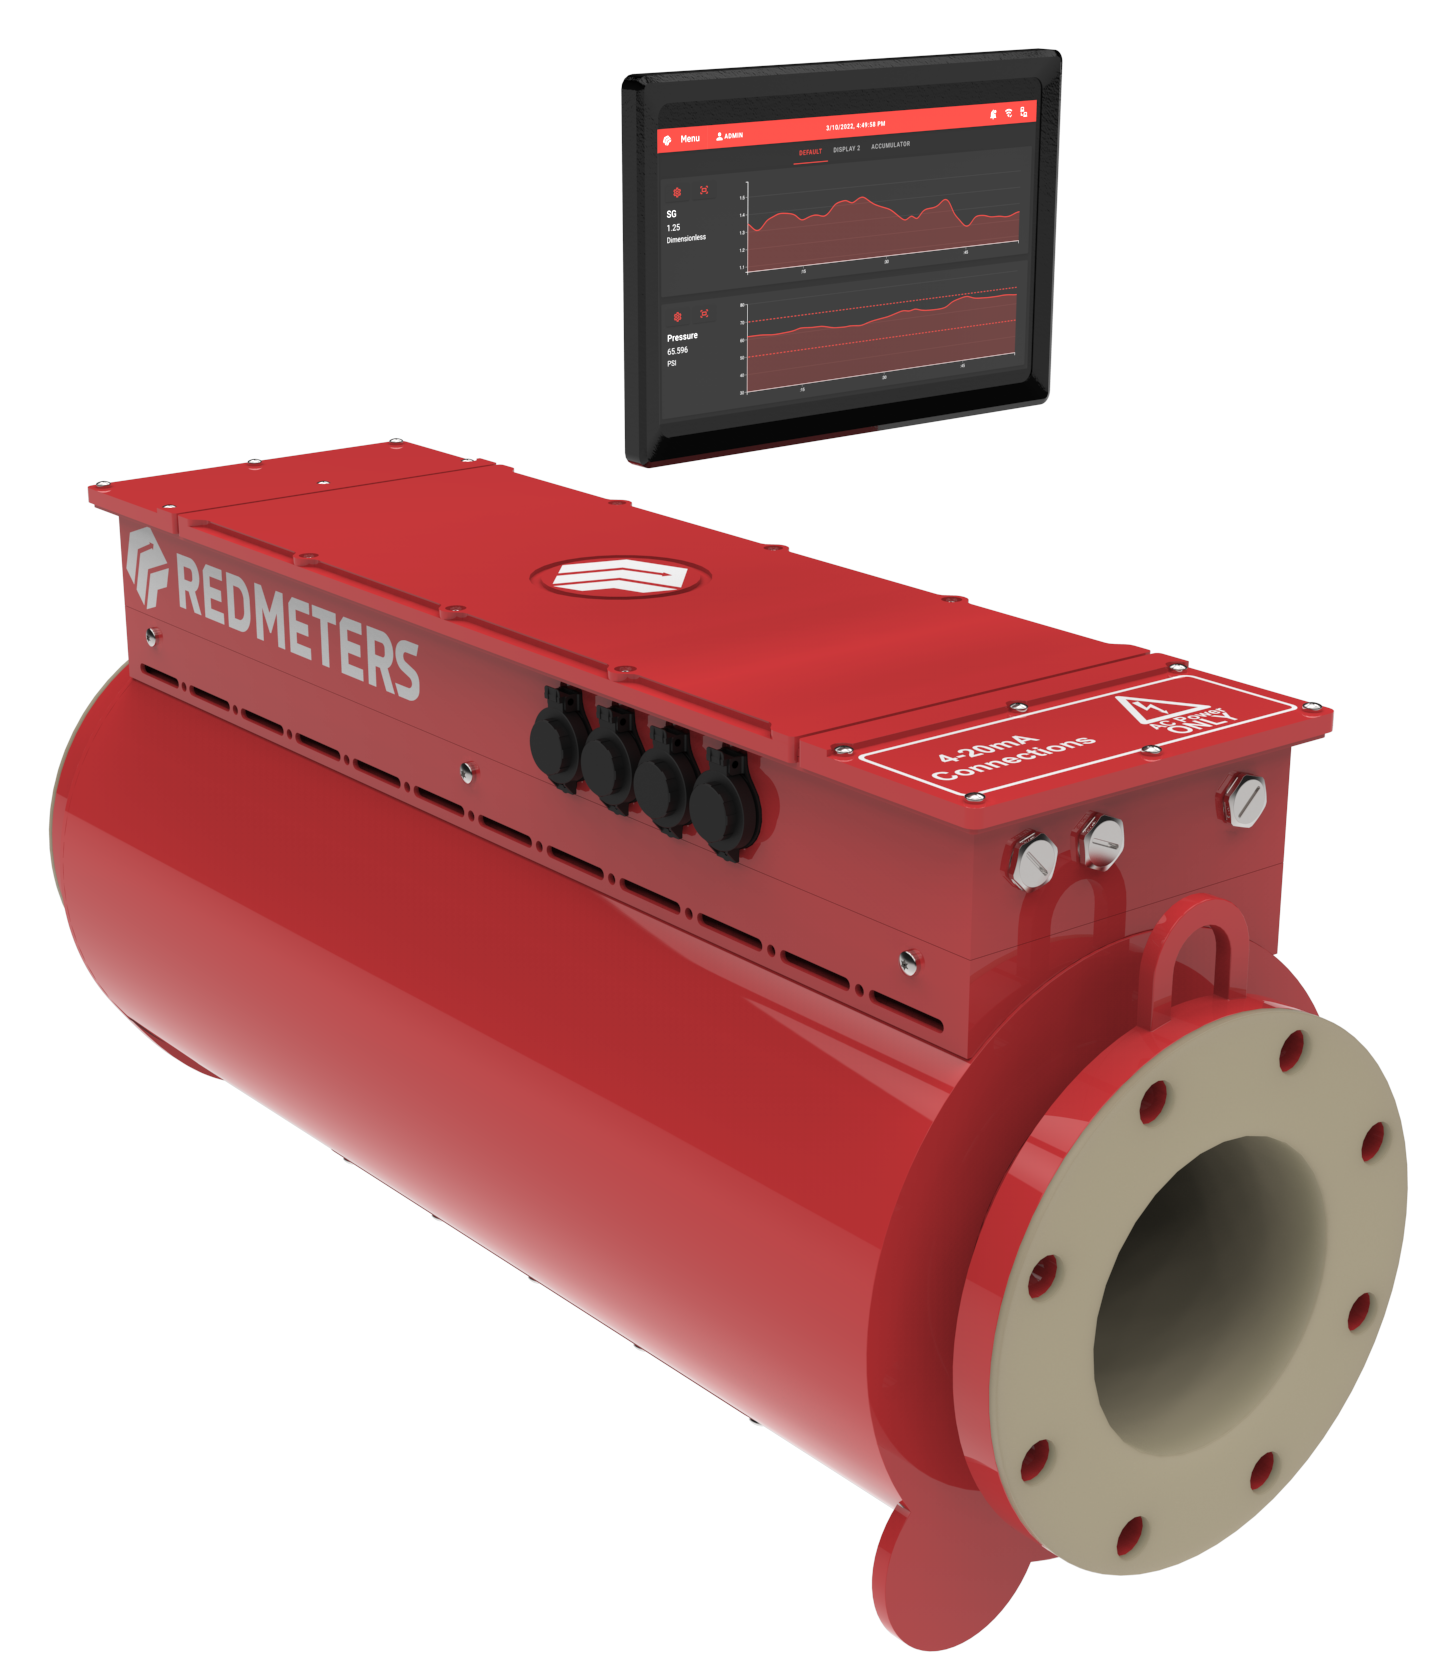
The Red Meter is a process control system. One inline device reads full-bore density, plus temperature, pressure and vibration from the same instrument, at the same point and the same moment.
Column
Figure, single-image
Numbered steps
Section heading
From pipe to decision, every second
The Red Meter reads your line continuously, so you see problems while the run is still going.
Figure, single-image
- 01Measure
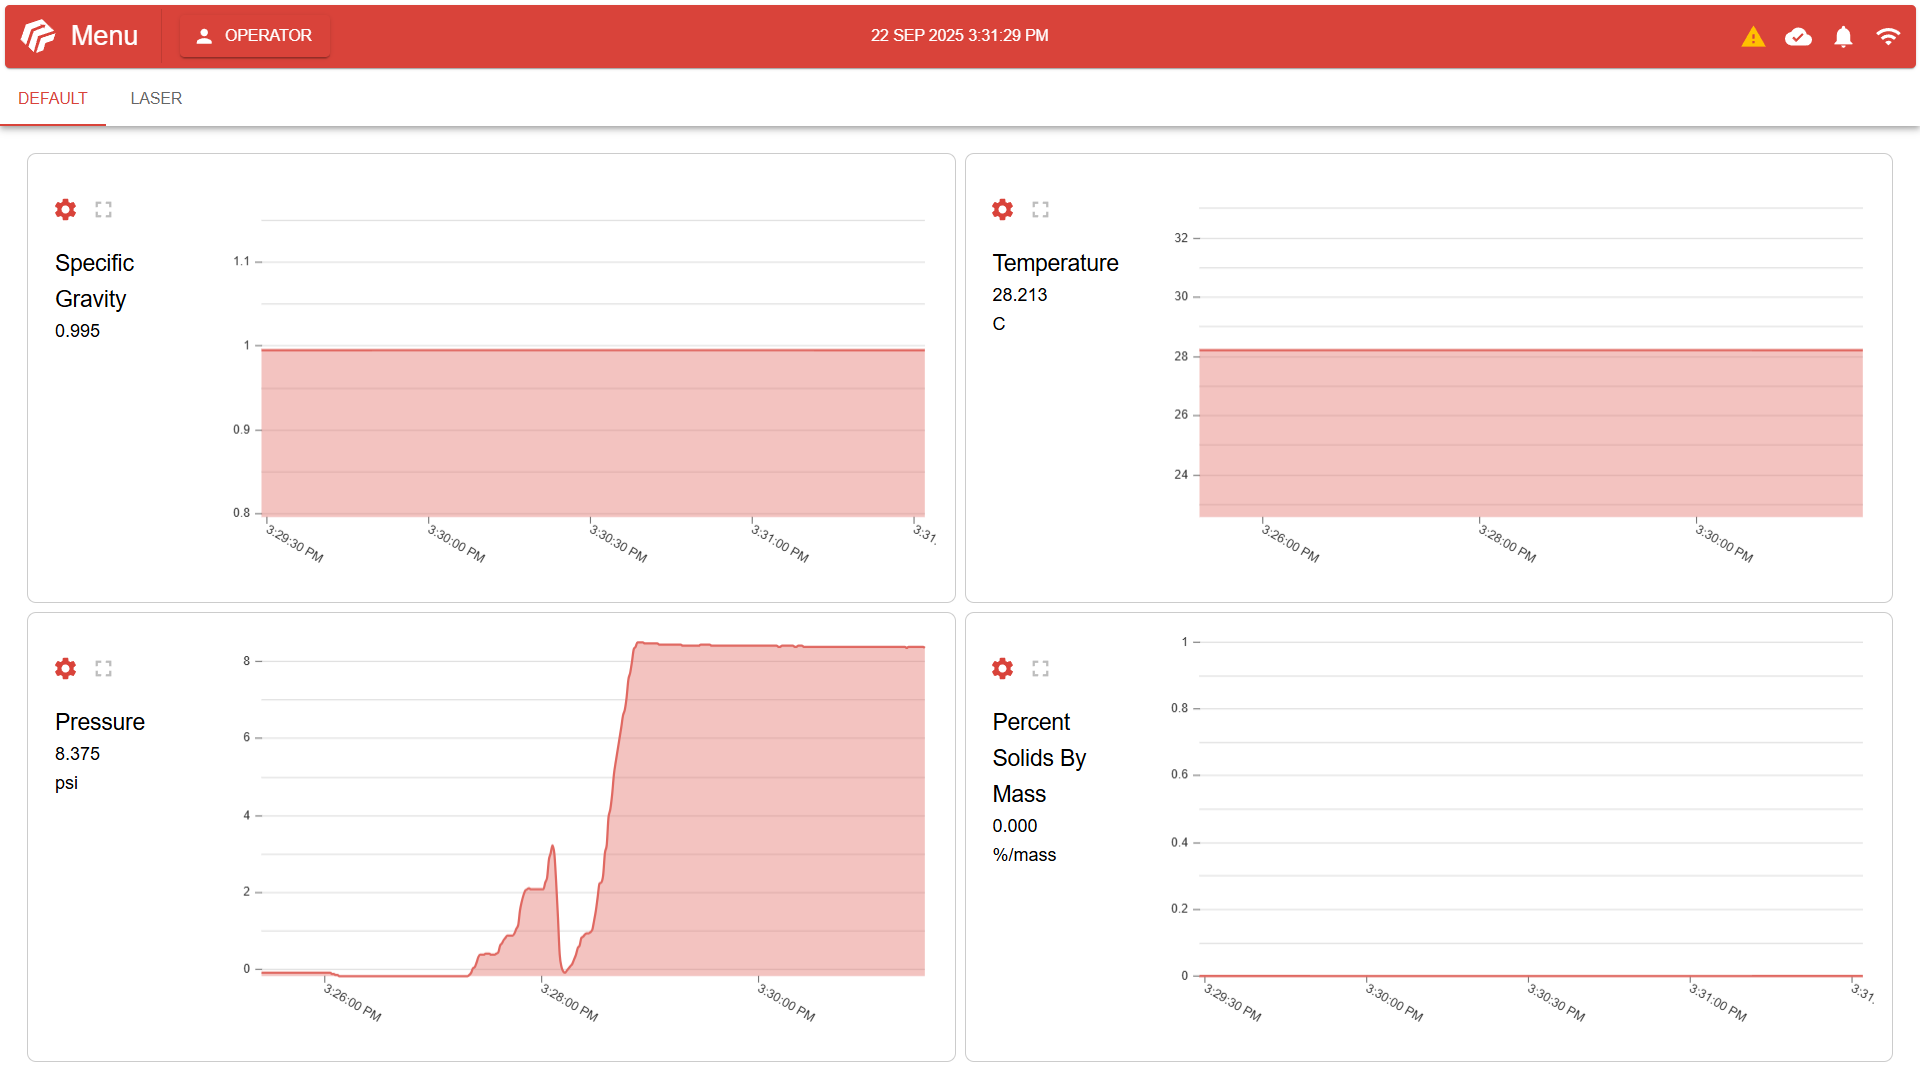
Density, temperature, pressure and vibration, taken together, with percent solids from the meter alone. Connect your 4-20 mA flow meter signal for mass flow and totalized solids.
- 02Detect
Oscillation, air in the pipe, bed load and other anomalies. Vibration is its own reading.
- 03Show
See the reading live in Red Meter software, updated every second. Configuration and calibration menus are PIN secured.
- 04Compare
Set today's run against your best run and see where it drifted.
Figure, single-image
Section heading
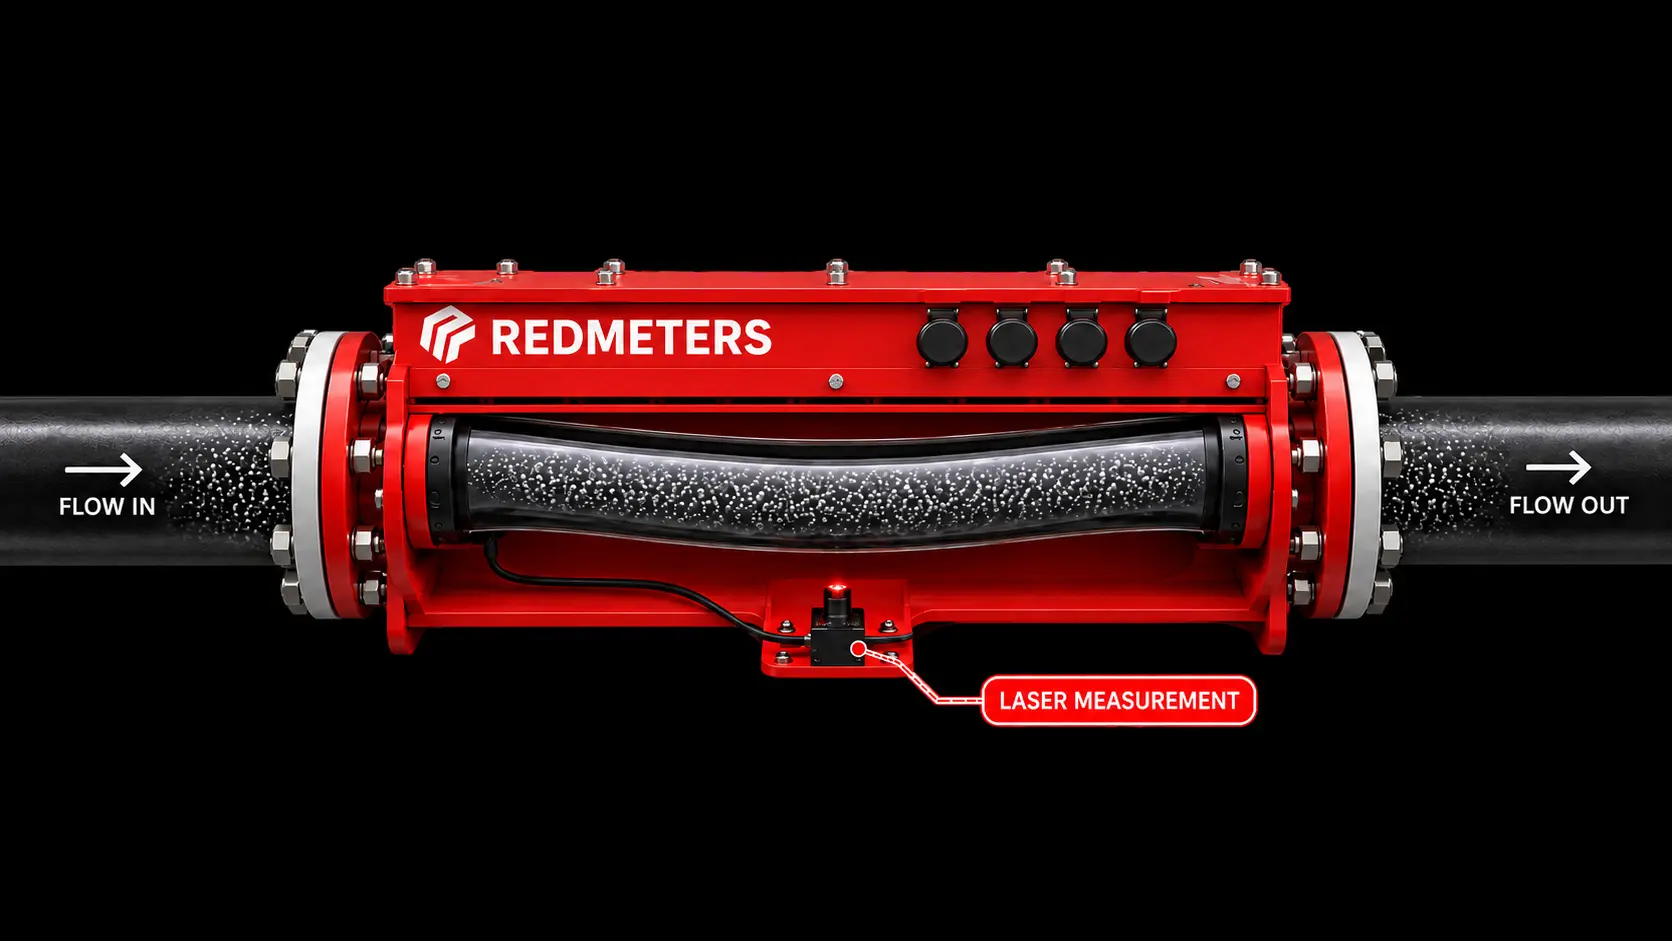
How the meter sits in the line
Figure, zoom
Section heading
What it catches while the run is still going
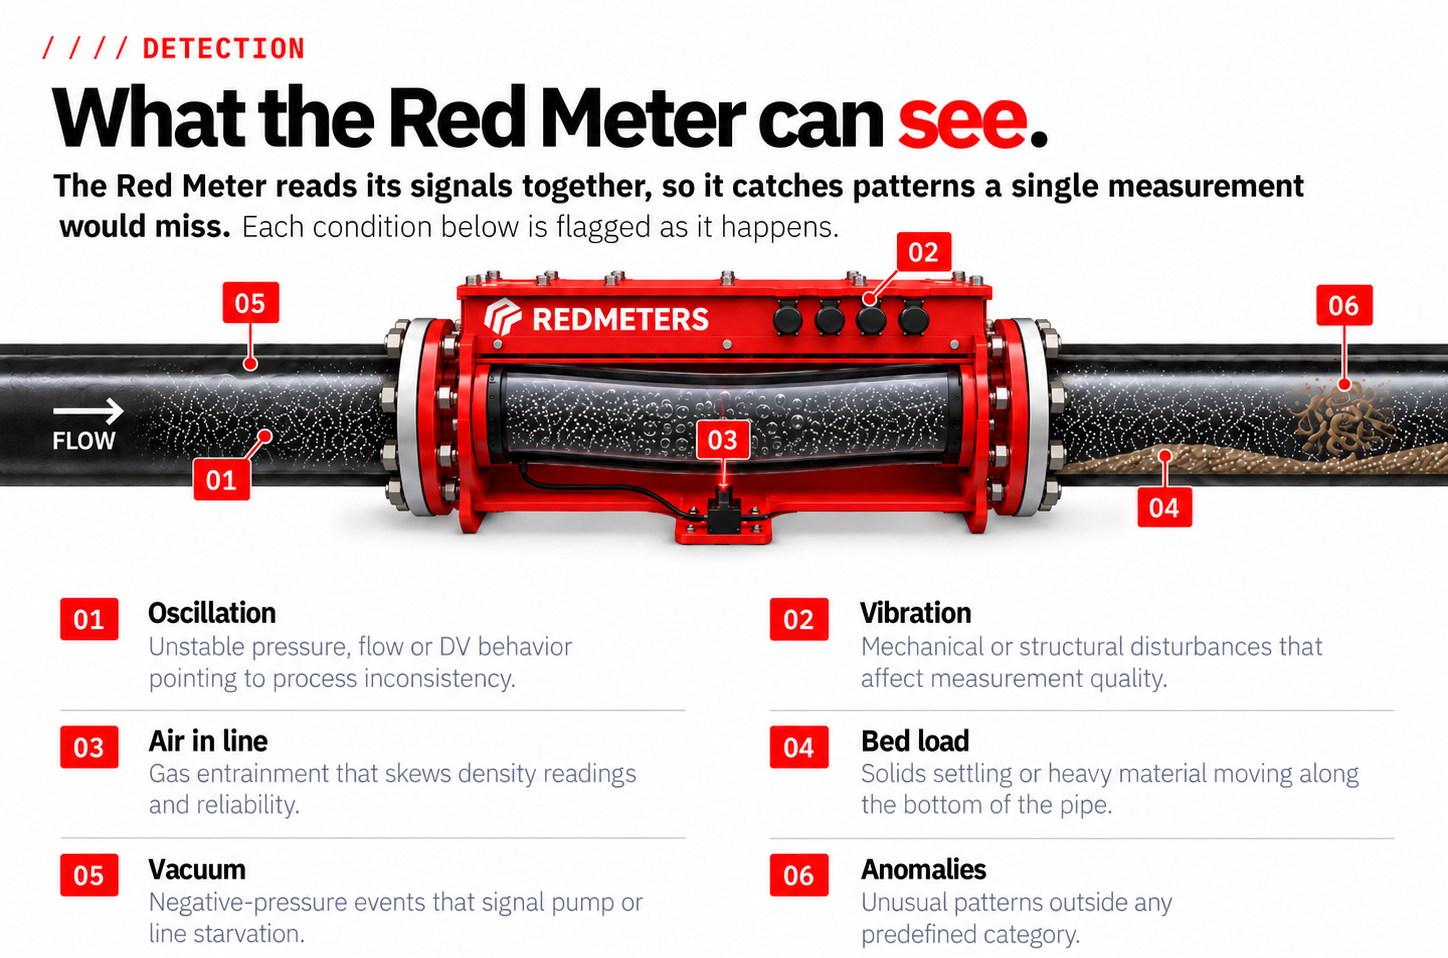
The Red Meter reads all its signals together. You catch patterns that one number on its own would miss.
- Air in the line: gas that throws off density, flagged as it happens.
- Bed load: solids settling and moving along the bottom of the pipe.
- Pressure and vibration are recorded with density every second, so unusual pressure events can be reviewed on the same timeline as the density reading.
- Scale buildup: extra mass in the pipe shows in the reading, so you can plan the flush.
Figure, multi-image
Section heading
Conditions flagged on the line
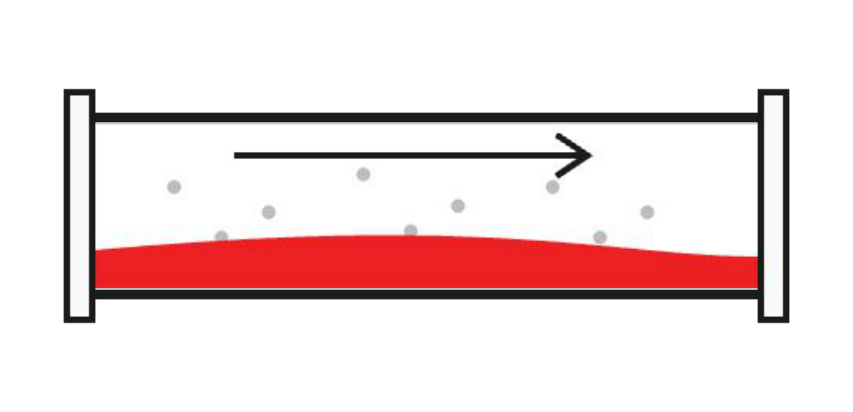
Bed load
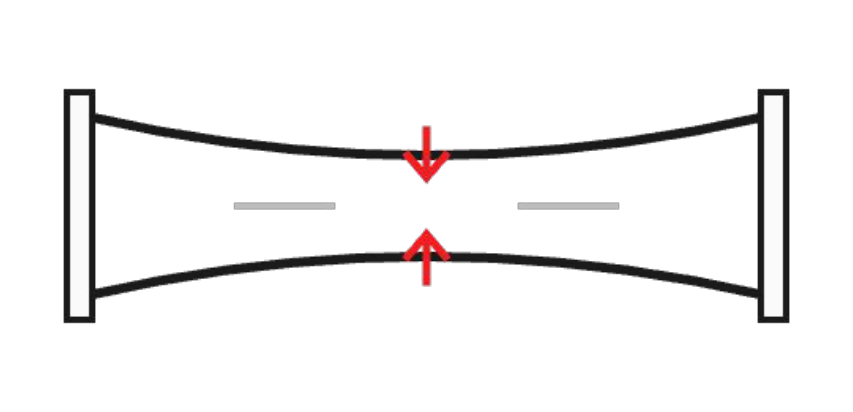
Vacuum
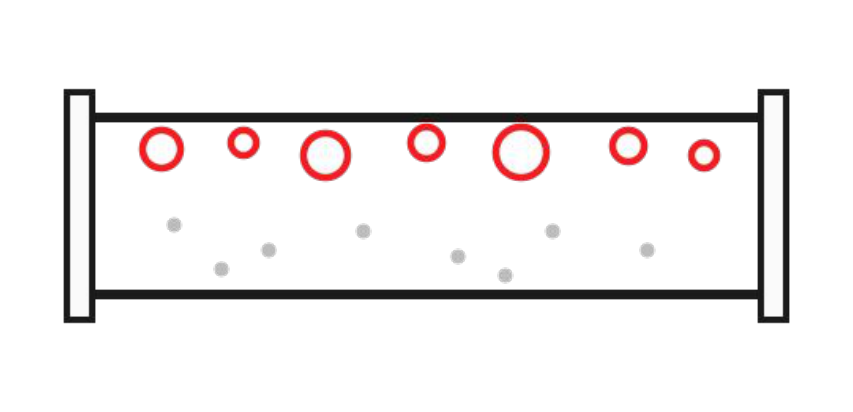
Air in the line
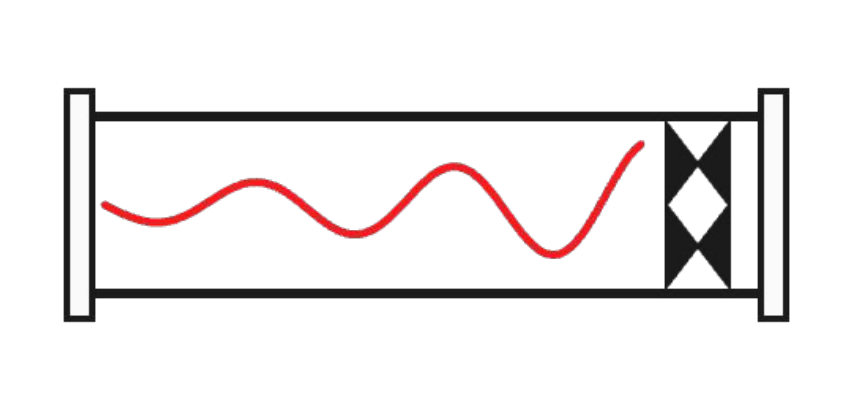
Oscillation and water hammer
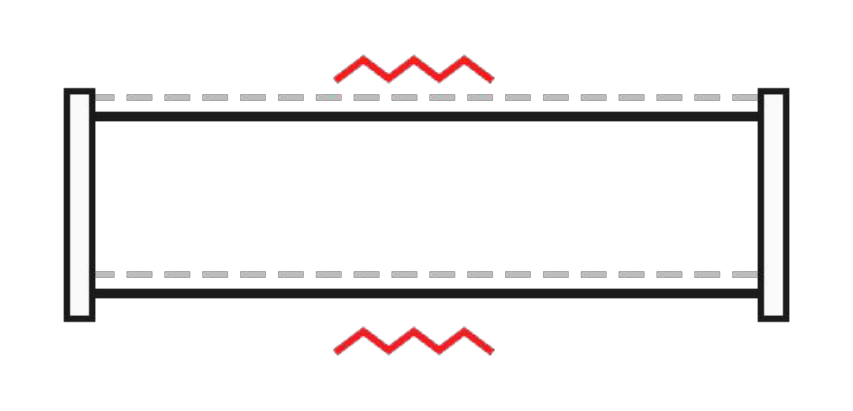
Vibration
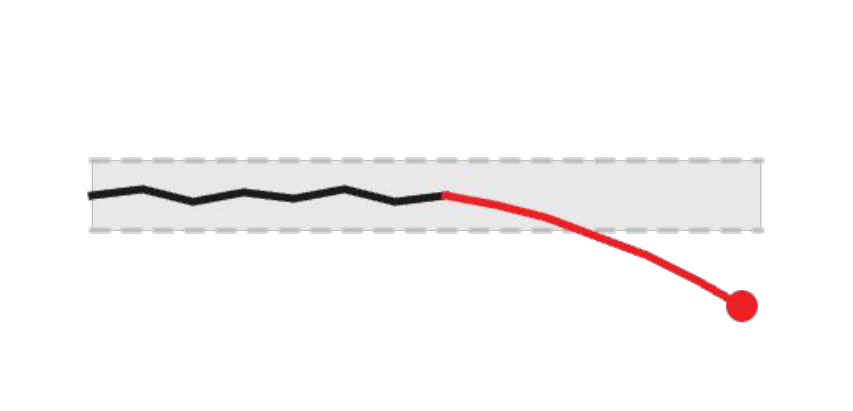
Drift
Live meter demo
Simulated data
See every reading and every alert in one place
Every reading on one screen, with alerts that show how long each event ran and how bad it got.
Nominal
Nominal
- Density
- 1.321 SG
- Percent solids
- 19.2%
- Temperature
- 48.0 °C
- Pressure
- 86 psi
- Vibration
- 12
Prose
Section heading
What you do with the readings
Full-bore density is the continuous reading. The other three readings come from the same device at the same moment.
Check any change in density against the lab sample you already take. Pressure from the same device shows whether the line is thickening or hammering, and air in the line shows up while the run is still going.
Send the reading to the control system you already have, over 4-20 mA or Modbus TCP/IP. Accuracy and the other operating limits are in the specifications below.
Spec table
Section heading
Specification overview
| Pipe diameter | 2-40 in / 50-1000 mm |
|---|---|
| Density accuracy | ±0.5% of full scale |
| Measurement update | 1 second |
| Interfaces | 4-20 mA, Modbus TCP/IP |
| Installation | Inline, standard flanges |
| Radioactive source | None |
FAQ list
Section heading
Questions engineers ask before they buy
Engineers often start there. The Red Meter is a process control system. Density is the full-bore reading. Temperature, pressure and vibration come from the same inline instrument.
No. Density comes from a Class 1 laser, FDA (CDRH) Part 1040.10. You have no radioactive source to license or dispose of.
Six configurable 4-20 mA outputs, and Modbus TCP/IP over RJ45.
Percent solids comes from a Red Meter alone. For mass flow and totalized solids, connect an external 4-20 mA flow meter.
The Red Meter is not for use below 0 psi. A vacuum relief valve is recommended.
Engineered and manufactured in the USA. Red Meters LLC is in Orlando, Florida.
We commission on site and support remotely, Monday to Friday.
Call to action
Section heading
Book a demo
Tell us your pipe size and what runs through it. We will confirm whether the Red Meter fits and show you the software. You do not need to assemble a group for the first conversation.
Button, primary
Book a Demo