


Stacked hero
Figure, single-image
Section heading
/ / / Power
Monitoring process changes in a gypsum-forming chemical line
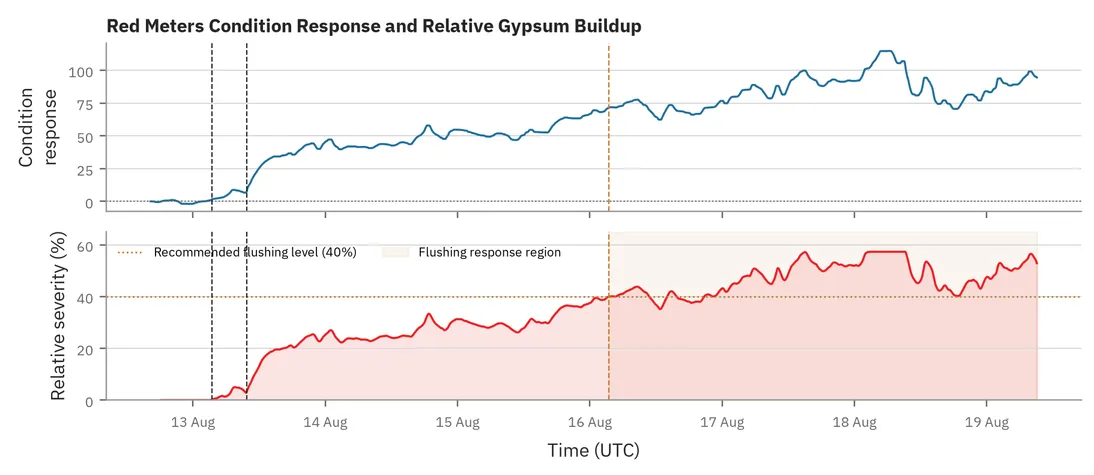
A 4 in Red Meter was evaluated on a weak phosphoric acid line carrying gypsum-forming solids. The study tracked changes in the measurement record associated with buildup and a later flushing event.
Prose
Section heading
What the record showed
Density is the variable that runs this circuit. Lab samples came from a separate tube at a different elevation. Severity is measured relative to this line's own record.
Stats band
Section heading
Buildup caught before the flush
57.3%
Peak relative severity before the 19 August flush
15.9 to 7.0
Mean absolute difference vs lab, kg/m3, after the condition was applied
Results table
Section heading
How the severity bands guided the flush
| Relative severity | Line condition | Response in the study |
|---|---|---|
| 0 to 15% | Clean or stable | Keep monitoring and the flush record |
| 15 to 25% | Early indication | Confirm it persists. Review recent process or rinse |
| 25 to 40% | Developing buildup | Find the next practical flush and keep trending |
| 40 to 50% | Flush level | Flush in the next suitable window |
| > 50% | Elevated buildup | Prioritize the flush and watch the rate |
Call to action
Section heading
Bring us your scaling line
Tell us the chemistry and the pipe size. Then tell us how you decide when to flush today.
Button, primary
Book a Demo