


Stacked hero
Figure, single-image
Section heading
/ / / Capstone Copper
Continuous density measurement evaluated against the plant laboratory
Pinto Valley metallurgy compared 15 paired samples from a 6 in regrind cyclone feed line with the plant lab. Mean solids were 19.29% on the Red Meter and 19.23% in the lab. A t-test at 95% confidence found no statistically significant difference on percent solids or specific gravity. That result does not by itself prove the two methods are equivalent.
Prose
Section heading
Live percent solids on cyclone feed, with no permit to chase
The regrind mill needed live percent solids on cyclone feed. Most density gauges on offer were nuclear, and the permits were hard to get.
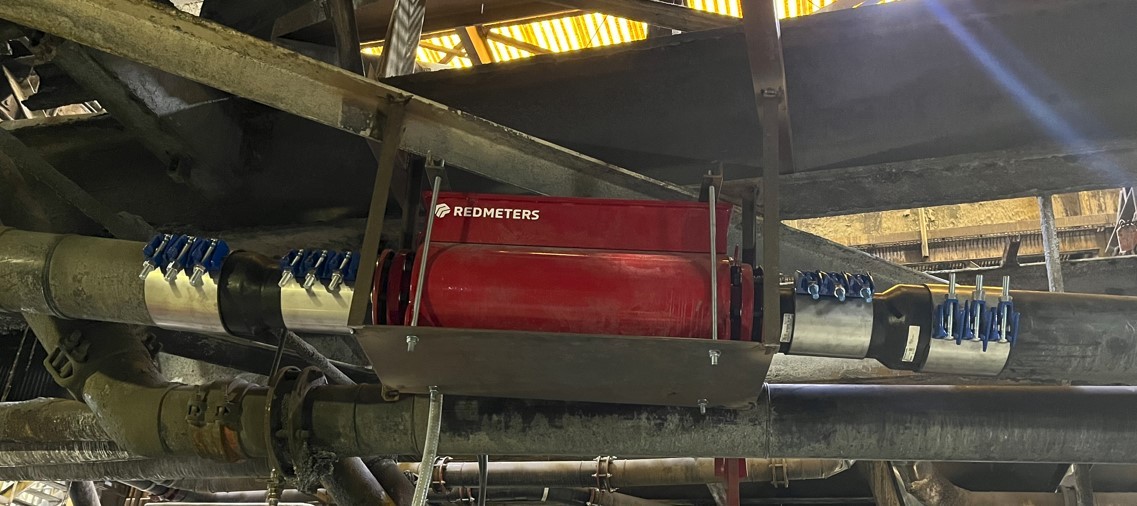
The Red Meter was installed inline on regrind cyclone feed, side 2, and commissioned with a one-point field calibration. Site metallurgy took 15 grab samples from that line at the same time as the reading, then assayed percent solids and specific gravity.
Results table
Section heading
No statistically significant difference from the lab
| Variable | The Red Meter | Laboratory | Difference | P-value |
|---|---|---|---|---|
| Percent solids | 19.288% | 19.230% | 0.058 | 0.467 |
| Specific gravity | 1.177 | 1.168 | 0.008 | 0.183 |
Prose
Section heading
What Pinto Valley recommended next
Pinto Valley recommended installing a Red Meter on the remaining regrind cyclone feed line. It also pointed to 4 in and 6 in moly plant lines, from feed through to tails, with flow meters for a live solids balance.
Call to action
Section heading
Bring us your cyclone feed
Tell us the pipe size and the lab method you already trust. We will show you how to check a Red Meter against it.
Button, primary
Book a Demo