


Download page
How the Red Meter keeps reading accurately despite scale buildup and tells you when to flush
As deposits build up inside a pipe, calibration drifts, readings wander, and operators end up flushing on a calendar built from habit rather than evidence. The Red Meter treats that same buildup as a signal, not a problem to filter out.
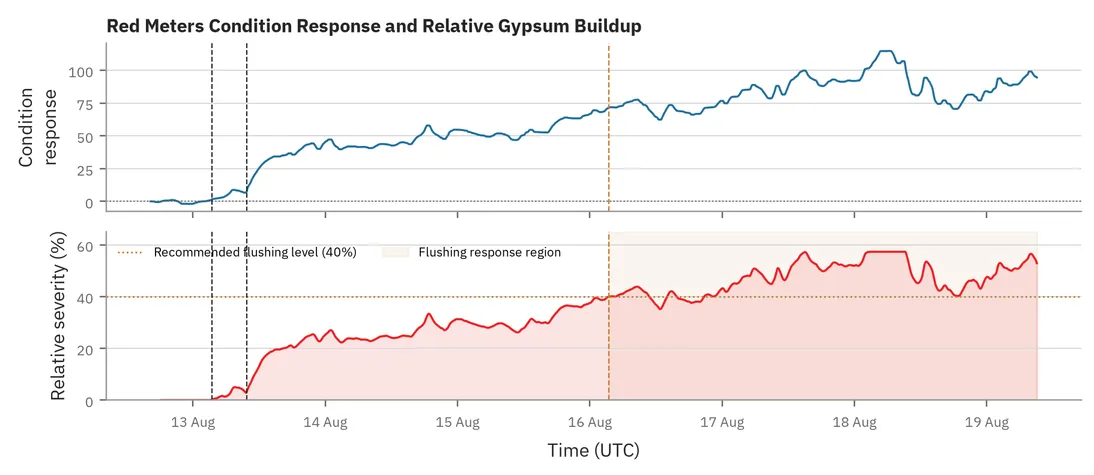
How a Red Meter detects buildup
Measure continuously. Density, temperature, pressure, and vibration are already being captured.
Identify the signature. Persistent density displacement and a changing statistical relationship to pressure and temperature reveal buildup.
Convert to severity. The condition is scored on a relative severity scale calibrated to the application, not a generic percent blockage.
Verify after flushing. The post-flush signal confirms whether the line actually returned toward clean.